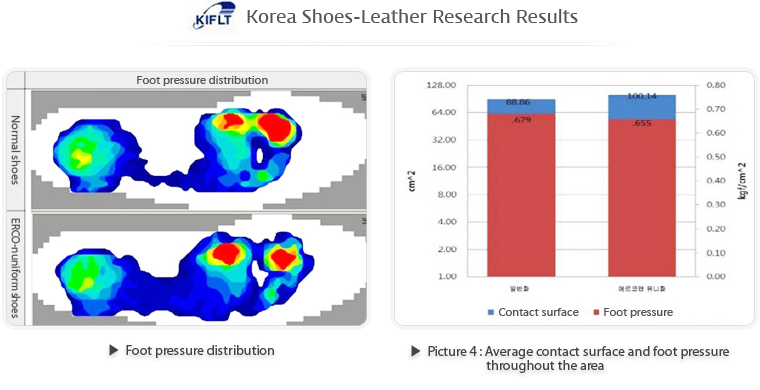
* Distribution analysis is shown in table 2 and picture 4
* Contact surface shoes significant differences with p value less than 0.05. A is 88.86 +- 5.16 cm2 and B is 100.14 +- 3.23
cm2. B has 12cm2 greater contact surface area.
* There were significant differences in foot pressure as well. B showed 0.024 kgf/cm2 less pressure compared to A (p < 0.05)
| Category |
Shoes |
N |
Average |
Standard deviation |
df |
F |
p |
| Contact surface |
A |
45 |
88.86 |
5.17 |
1 |
161.137 |
0.000 |
| B |
48 |
100.14 |
3.23 |
| Foot pressure |
A |
50 |
.679 |
.072 |
1 |
3.620 |
0.060 |
| B |
50 |
.655 |
.050 |